This article is part of a series of articles:
- Forging a Kubernetes cluster in your garage
- Preparing application deployment
- Prometheus grafana deployment in Kubernetes
- Deploying our first application
We will base ourselves on kube-prometheus which packages the deployment and automatic configuration of a Prometheus + Grafana stack which is a standard stack in the industry today.
1. The Prometheus + Grafana stack
a. Importance of monitoring
“There is no delegation without control”
What is often true for humans is even more true for machines. When running an application, it’s hard to know what’s happening in it.
The first way to understand their functioning is logs. In my opinion, the huge problem with logs is their volume. If we’re not careful, the log flow can become the most important flow of an infrastructure and therefore monopolize too large a share of production infrastructure resources.
The second method, which in my opinion is sufficient in 95% of cases, is metrics. We store numerical values in a time series database, which takes much less space and offers much better search/processing/correlation capabilities.
Data is stored in the format:
<timestamp> <tag> ... <tag> <value>
At a precise moment, a value, identified/sorted with tags (to recognize one or more value series by filtering on these tags)
Once stored, this data is made available to any application capable of querying it.
b. Prometheus
Prometheus is both a metrics storage database and a data collection tool.
It’s not just a database, like influxdb for example. Prometheus will come to retrieve data from any application capable of exposing in web format a text file of this format:
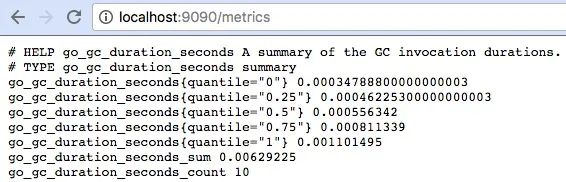
Prometheus can connect to various information sources (like kubernetes for example) to do discovery to automatically find applications exposing metrics.
c. Grafana
Grafana is a visualization tool for these metrics, offering a simple interface to create dashboards with different types of graphs, tables, counters, which allow effectively visualizing all metrics stored upstream.
Grafana is compatible with a large number of sources, including prometheus, and remains a standard for creating visualizations.
d. Our monitoring architecture
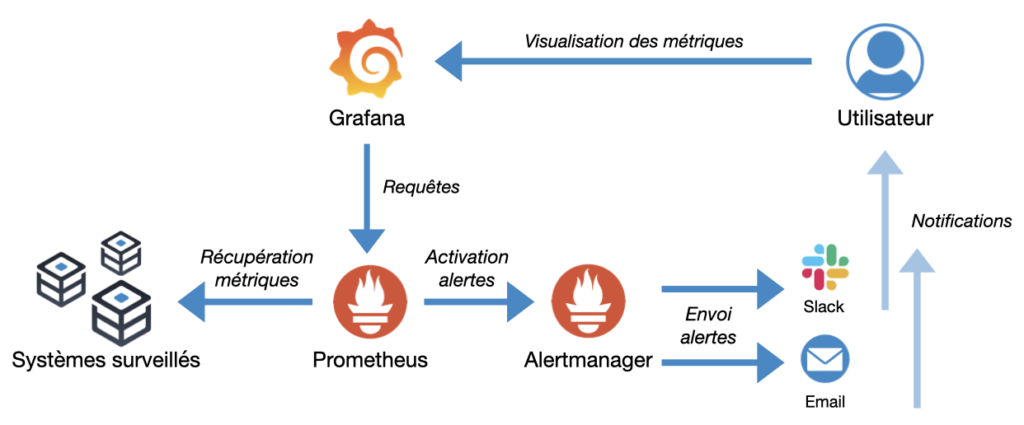
Compared to the diagram above, we will limit ourselves to Prometheus and Grafana, alertmanager and the different alerting channels can be added later.
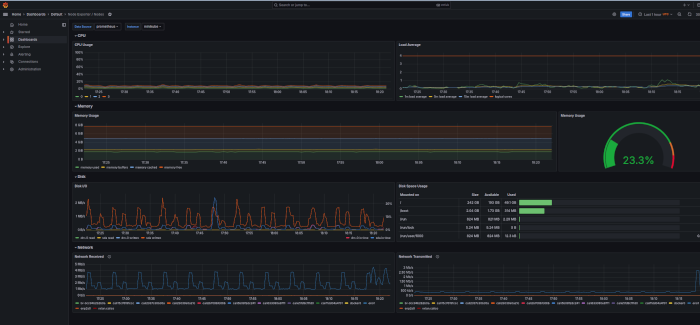
kube-prometheus contains a number of useful dashboards for managing our kubernetes cluster.
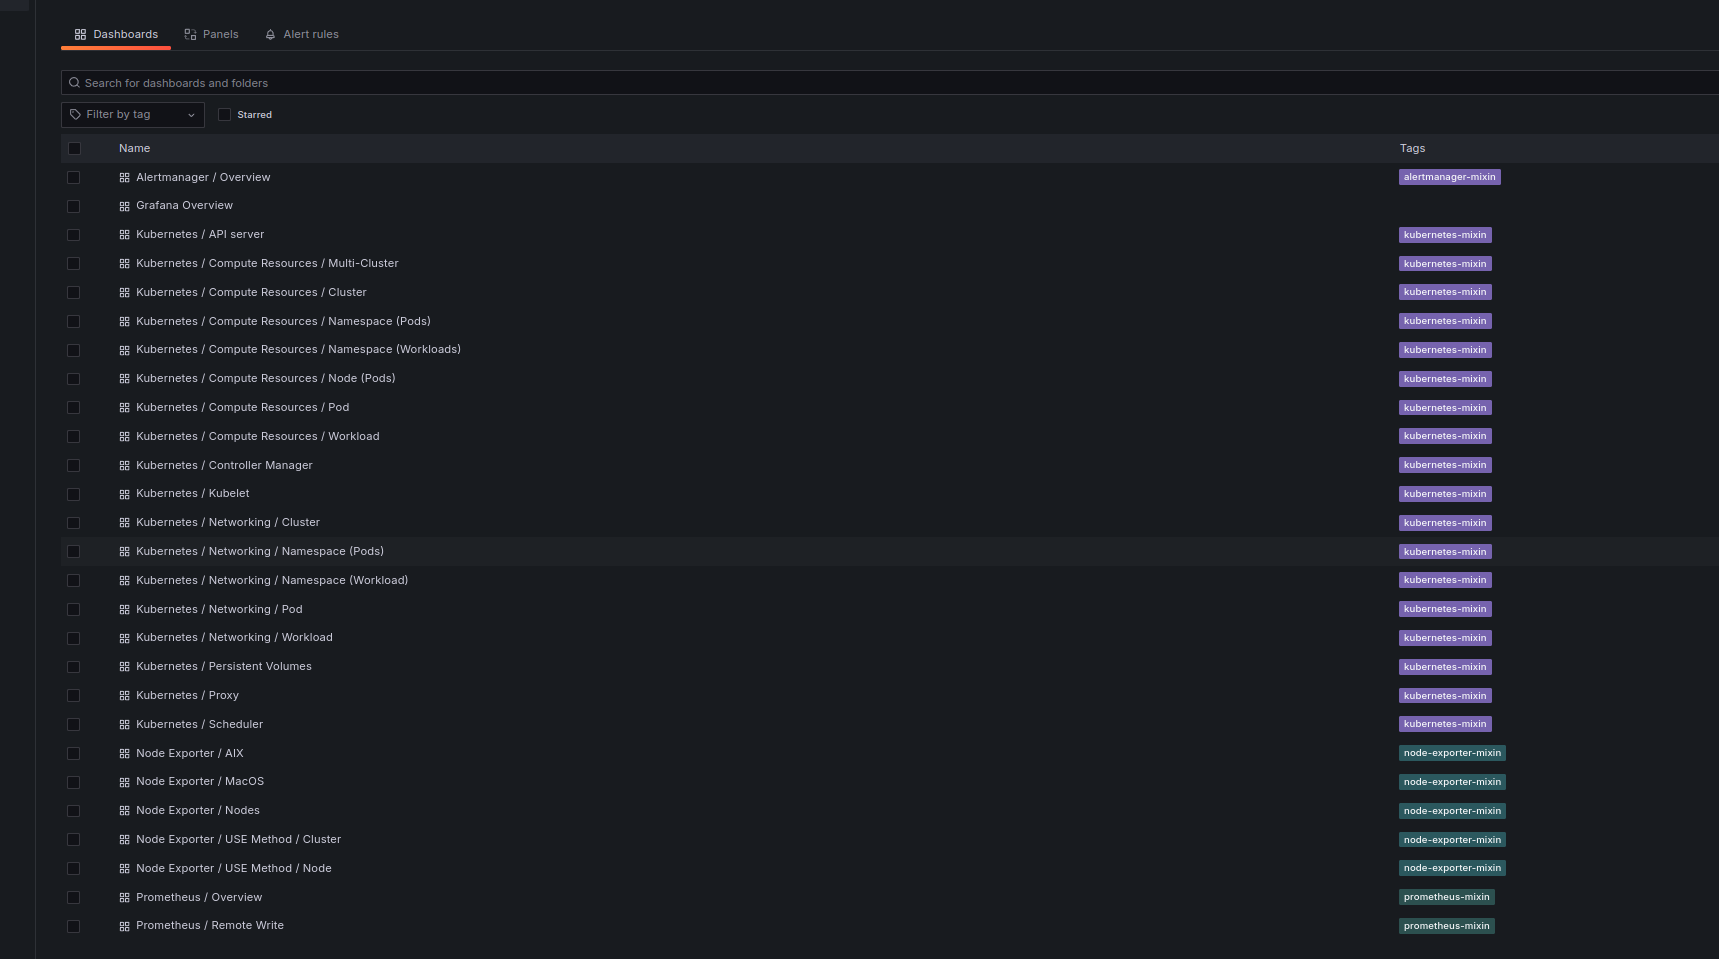
An example of a grafana dashboard automatically deployed by kube-prometheus:
2. Installation
We will again connect to the main machine, to centralize our commands.
We will clone the kube-prometheus repository:
git clone https://github.com/prometheus-operator/kube-prometheus
We enter the retrieved folder
cd kube-prometheus
then we will create resources necessary for deployment
microk8s kubectl apply --server-side -f manifests/setup
and finally we install the monitoring stack
microk8s kubectl apply -f manifests/
the complete installation doc is here
And there you go everything is installed!
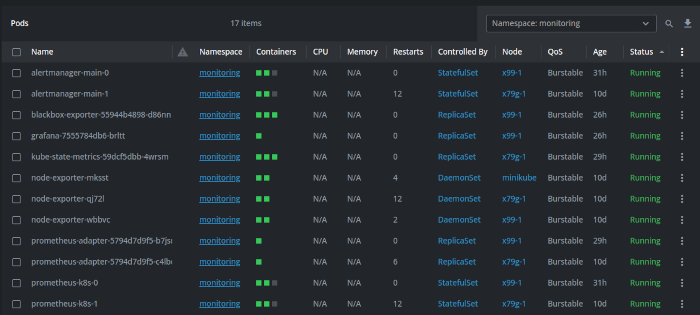
A quick tour in the monitoring namespace confirms the presence of pods: